

Retail shrinkage prevention starts with one plain fact: shrink is the gap between the stock your records show and the stock you can count, and theft is only part of it. In the National Retail Federation’s 2023 security survey, theft made up 65% of shrink, and process errors, such as cashier errors, inaccurate pricing and damage, made up another 27%.
NRF notes that process errors and training gaps are non-theft losses that retailers can often control through operational improvements. This guide shows how to calculate shrink, where it comes from, five store routines that cut the avoidable part, how to keep evidence when something goes missing and how to review the pattern each month. It builds on our guide to retail inventory accuracy and belongs to our wider overview of retail operations.
What retail shrink is and how to calculate it
NRF describes shrink as a measure of inventory loss that compares a retailer’s book inventory with the physical inventory on hand, calculated as a percentage of sales. It includes external theft such as shoplifting, employee theft and vendor fraud, and also non-theft losses such as administrative errors, damages, expired goods and spoilage.
To calculate the shrink rate for one store between two counts:
Shrink rate = ((book inventory − counted inventory) ÷ sales since the last count) × 100
The shrink rate is the gap between book and counted inventory as a percentage of sales since the last count. Book inventory is what your records say should be on hand, and counted inventory is what the count finds. Value both the same way, at cost or at retail. If the books show $350,000 of stock, the count finds $342,000 and sales since the last count were $500,000, the gap is $8,000 and the shrink rate is $8,000 ÷ $500,000 × 100 = 1.6%.
Treat the rate as a signal, not a verdict, because retailers calculate it in different ways. Some value stock at cost and others at retail, some include damages or promotional adjustments and others do not, and counts happen annually, quarterly or more often. NRF concluded that an average annual shrink percentage was no longer an accurate benchmark and stopped publishing an industry figure in 2023.
The last one, in its 2023 survey release, was 1.6% of sales for fiscal 2022, up from 1.4%, which NRF put at $112.1 billion in losses. In that survey, pharmacy, grocery, department stores and mass merchandise averaged more than 2%. Use that as history. Compare a store with its own earlier counts first.
A percentage also hides scale. In NRF’s example, two stores each lose $2 million: a store with $100 million in annual sales shows a 2% shrink rate, and a store with $1 billion in sales shows 0.2% for the same loss. Track the dollar loss next to the rate.
The rate also arrives late. It comes from a full physical count, which NRF says is done annually or perhaps twice a year, so it describes what happened rather than what is happening. Cycle counts and reported incidents show loss sooner, and that is where the routines below put their evidence.
Where retail shrink comes from
The 2023 survey asked senior loss prevention and security executives at 177 retail brands, with more than 97,000 locations across the United States, to split their shrink by source. These are the averages for fiscal 2022:
| Source of loss | Share of shrink | What the survey counts |
|---|---|---|
| External theft, including organized retail crime | 36% | Shoplifting, burglary or break-in, robbery, credit card fraud and other crimes by non-employees |
| Internal (employee) theft | 29% | Theft by an employee, or by outsiders working with one, such as cash theft, fraudulent refunds and merchandise theft |
| Process, control failures and errors | 27% | Cashier errors, inaccurate system pricing, accidental loss or damages and other operational errors |
| Unknown | 6% | Reported losses that may not be properly categorized |
| Other | 1% | Business-specific losses, which may include expired goods, vendor or third party losses and claims |
Source: NRF, National Retail Security Survey 2023, averages for fiscal 2022.
Theft made up 65% of shrink in the 2023 survey, 36% external and 29% internal, and process errors made up 27%. The shares are averages of what respondents reported, and they add up to 99%. The 6% of unknown loss is the part respondents could not place in a category. A loss that nobody writes down when it happens usually has no reason by the time the count finds it.
The mix depends on the store. Some retailers reported external losses above 40% of their shrink, while those that sell luxury or personal care items under lock and key might see a lower rate of external loss.
Shrink also leaves things out. In the survey, 78% of respondents do not include ecommerce goods loss in their shrink calculation and 57% do not include supply chain loss or theft, so the report concludes that the actual dollar loss from shrink is likely heavily underreported. NRF adds that supply chain theft may be recorded in the cost of goods sold, before items are officially accepted into inventory, so the shrink figure can miss loss that happens before a delivery is accepted.
Retail shrinkage prevention: five routines that cut avoidable loss
The routines below help a store reduce shrinkage where the loss starts. Each has a place, an owner and a rhythm.
Receiving: count before you sign
Once the driver leaves, a gap is the store’s problem. A shortage or a damaged carton that is not written on the delivery document at the door is much harder to claim later, and supply chain loss may never reach the shrink figure at all.
Count the cartons against the delivery note at the door, open any damaged carton and photograph it, write each shortage or damage on the delivery document before signing, and report it to the supplier the same day. The receiver owns the count at every delivery, and the store manager checks one delivery a week against its note. Our retail goods receiving checklist has the full sequence.
Stockroom: know who can reach what
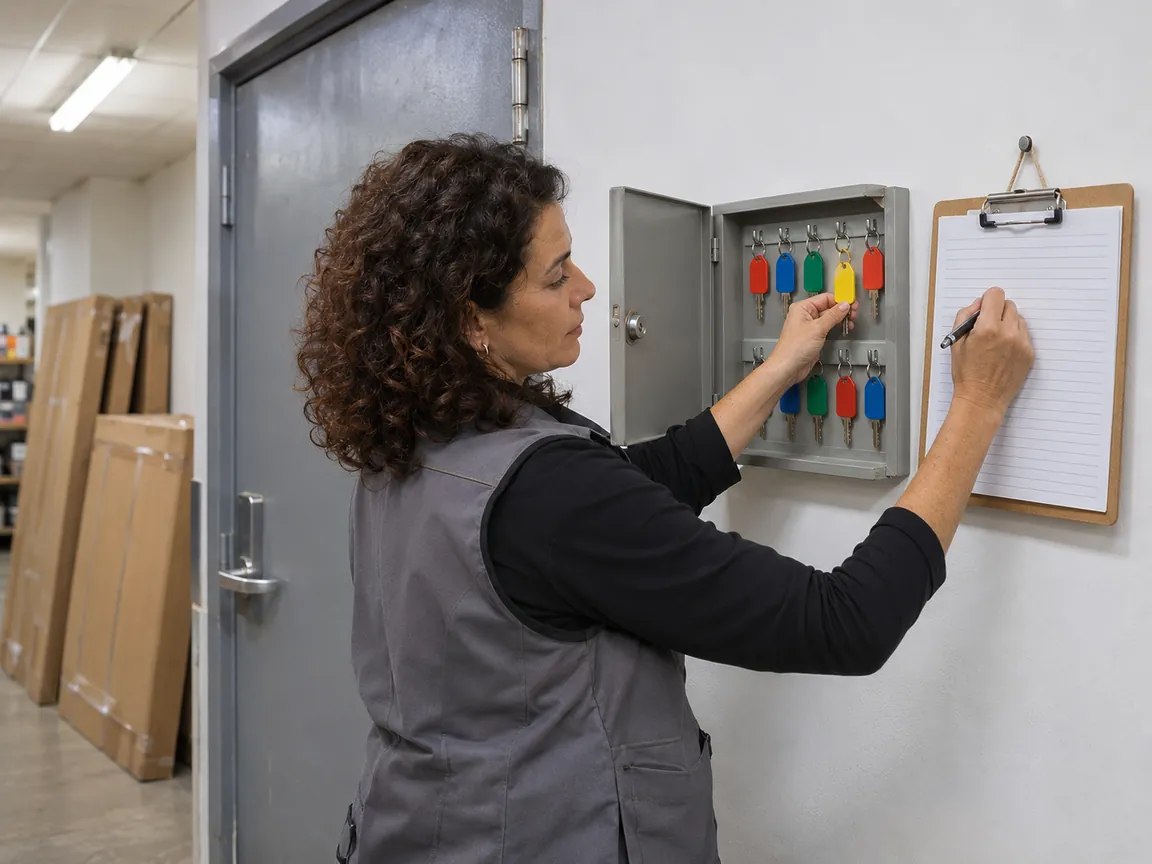
Internal theft averaged 29% of shrink in the survey, and the report notes that employees have more access to merchandise and money than outsiders do. The average internal theft cost $2,180 per investigation. Put every key on a board and log who takes which key and when. Limit the cage that holds high-value or fast-resale stock to named staff, and count it on a fixed day each week with a second person watching.
The aim is not to suspect anyone. It is to narrow a gap to a few days and a short list of people with access, so the cause can be found. Tidy storage helps as much as locks, because stock in the wrong place looks missing at the next count. Our guide to retail stockroom organization covers locations and put-away.
Sales floor: lock the targets and keep them in view
Retailers in the survey rated locking cases, lock boxes and cages among the ten measures most successful against external loss, next to CCTV, exception-based reporting and employee training. The targets are not only expensive items. NRF’s release says organized retail crime groups have expanded from their traditional targets to categories like outerwear, batteries, energy drinks, designer footwear and kitchen accessories, and that shoplifters also take everyday products with fast resale value.
Build your own target list from the products that come up short at counts and in incident reports, and review it each month. Move the top few into a locked case or behind the counter, keep gaps in displays filled so a missing item is easy to see, and walk the floor at set times to check that cases are locked and restocked.
Decide in writing what staff do when they see a theft, and make the rule a safe one. In the survey, 41% of respondents said no employees are authorized to stop or apprehend shoplifters, up from 38% a year earlier. A workable rule is that staff do not chase or confront anyone: they note what they saw, tell the manager and add it to the incident log.
Checkout: check refunds, voids and prices
The register shows up twice in the survey’s findings. Refund fraud and cash theft were among the top four reported methods of internal theft, and process errors include cashier errors and inaccurate system pricing.
Set a refund limit with a second approver, who sees both the item and the receipt. Once a week, have the manager read the register’s exception report, for example refunds, voids and no-sale openings by cashier and shift, and look for a pattern before asking about any single transaction. Exception-based reporting software and programs also appear first on the survey’s list of the top five measures retailers use against internal theft. Check a sample of shelf prices against the checkout every week as well. Our retail sales audit guide covers transaction checks, and our retail price audit guide covers shelf and checkout prices.

Dates and damage: write it off the same day
Damaged and expired goods are shrink even though nobody took them: NRF lists damages, expired goods and spoilage next to theft. Check dates by category at set times, pull or mark down each item under your own rules, and keep damaged stock in one marked place instead of on the shelf or in the back of the stockroom.
Log every item with the quantity, the reason and a photo, and book the write-off the same day. A write-off with a reason is a known loss, and one without it becomes part of the unknown share at the next count. Our retail damaged goods procedure and retail expiration date tracker guides show the fields and the follow-up.
Keep the evidence and escalate
A loss that nobody writes down becomes part of the unknown. Whatever happened, record the same things every time: what happened, where and when, what was done at once, the evidence, such as a photo or a receipt, who was told and what follows. Write it the same day, while the details are fresh.

Escalation needs one rule: every record has one owner who reads it within a day. The store manager closes the small ones, such as a damaged carton or a price mismatch. Repeat losses of the same product, shift or register go to the area manager or the loss prevention team. Suspected employee theft goes to the manager, HR or loss prevention under your company policy, and the store does not question anyone itself. If anyone is at risk, call the police first. For the form and a filled example, see our retail incident report template guide.
Review the pattern every month
Once a month, read each store’s log next to its counts. The shrink rate alone is a late signal: NRF calls shrink a lagging indicator, useful for describing what happened but not ideal for seeing where losses are building or where controls are weak.
Start with how much of the loss you can explain:
Explained share = (loss logged with a reason ÷ total loss found in counts) × 100
In the example above, the count found an $8,000 gap. If $5,600 of it was logged with a reason, such as damage write-offs, receiving claims and incident reports, the explained share is $5,600 ÷ $8,000 × 100 = 70%. The other $2,400 is the part to chase.
Then read three things in the log: which reason has the most dollars, which product, shelf area, shift or register keeps coming back, and which items stayed open longest. Pick the largest reason, give it one owner and one date, and count that area again next month. A retail cycle count of one area is quicker than waiting for the next full count, and our retail inventory discrepancy investigation guide shows what to do with a gap that no record explains.
Run the same routines in every store
Routines like these fail quietly when nobody can see whether they happened. Bitreport task management sends the same repeating checklist to every location, with due dates and required photo proof, and managers can follow completion by location. That suits the receiving count, the key log check, the weekly case check and the date walk. On store visits, a failed item in an audit creates a corrective task with an assignee, a due date and a photo proof request, and repeated issues are flagged. Store teams can also report an issue from a phone with photos and notes, and managers track each one from submission to resolution with deadlines and proof.
Bitreport is not an inventory system and does not keep your stock records or detect theft on its own, so the counts, the records and any investigation stay in your own systems and with your own team. To see how these routines look across locations, book a Bitreport demo.
Frequently asked questions
What is retail shrinkage?
NRF describes shrink as a measure of inventory loss that compares a retailer’s book inventory with the physical inventory on hand, calculated as a percentage of sales. It includes external theft such as shoplifting, employee theft and vendor fraud, and also non-theft losses such as administrative errors, damages, expired goods and spoilage.
How do you calculate the shrink rate?
The shrink rate is the gap between book and counted inventory as a percentage of sales since the last count. If the books show $350,000 of stock, the count finds $342,000 and sales since the last count were $500,000, the gap is $8,000 and the shrink rate is $8,000 ÷ $500,000 × 100 = 1.6%.
What is a good shrink rate in retail?
NRF concluded that an average annual shrink percentage was no longer an accurate benchmark and stopped publishing an industry figure in 2023. The last one, in its 2023 survey release, was 1.6% of sales for fiscal 2022, up from 1.4%, which NRF put at $112.1 billion in losses. Use that as history. Compare a store with its own earlier counts first.
What causes most retail shrinkage?
Theft made up 65% of shrink in the 2023 survey, 36% external and 29% internal, and process errors made up 27%. NRF notes that process errors and training gaps are non-theft losses that retailers can often control through operational improvements.