

When a shopper finds an empty slot, 31% go to another store for the item on average and 9% do not buy it at all. Those are the averages across eight product categories in a 2002 review of 52 studies. The same review traced 70% to 75% of retail out-of-stocks to practices at the store, such as ordering and restocking the shelf.
Most empty shelves have a cause the store can find by checking, and a person who can fix it. This guide shows how to count the gaps, sort each one into a cause and an owner, and decide what to fix first. It builds on our guides to retail shelf replenishment and retail inventory accuracy, and belongs to our wider overview of retail operations.
How to measure retail out-of-stocks
An out-of-stock is a product the store means to sell that a shopper cannot find in its place. A 2007 guide by Thomas Gruen and Daniel Corsten counts it from the shopper’s side: a product in the stockroom, on the wrong shelf or behind another product is still a gap. The 2007 guide calls a gap a hole, meaning an item with a shelf tag or a place in the planogram and nothing on the shelf that a shopper can see.
To put a number on it, walk a fixed list of products, such as one category, and count the holes:
Out-of-stock rate = (products with an empty slot ÷ products on the list) × 100
The out-of-stock rate is the share of products on a fixed list that have an empty slot during the walk. If 5 of the 50 products on the list have an empty slot, the rate is 5 ÷ 50 × 100 = 10%. That is the 2007 guide’s own example. Retailers also call the flip side on-shelf availability: 100% minus the rate, or 90% here. Keep the list the same from walk to walk, or the numbers cannot be compared.
For scale, the 2002 review averaged 8.3% across 40 studies, with most between 5% and 10%, and faster-selling or promoted products regularly above 10%. It is a sense of scale, not a target: those studies looked at fast-moving consumer goods, mostly grocery, and used different measurement methods. A store with a different assortment will land elsewhere, so compare it with its own earlier walks first.

Walk the shelf so the gaps show
A walk only counts the gaps it can see, and the 2007 guide lists several ways it misses them. Audits are often done “first thing in the morning when the shelves are more likely to have been restocked,” and a week of audits can be too short, because out-of-stock rates swing from day to day. In 13 studies that reported time of day, the highest rates came in the evening, after 8:00 PM, and the lowest in the early afternoon. Walk at set times that include an evening and a weekend day, and write the time next to every count.
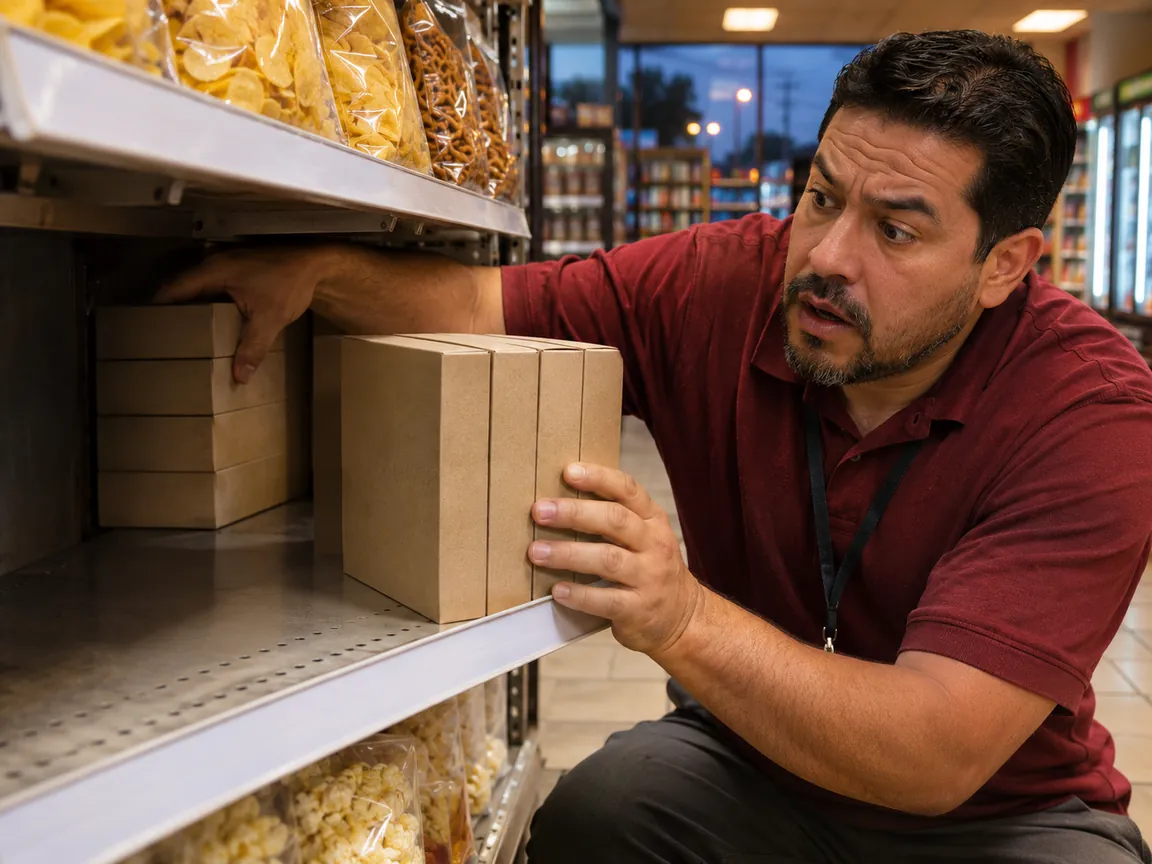
The 2007 guide lists four ways a gap stays hidden. The wrong product sits under a tag, so a quick look sees a full shelf. The tag is removed once the product runs out, so the slot drops out of the count; in a study of about 40,000 observations in 24 stores of one U.S. retailer, 7% of those for products the stores carried had no shelf label. Overflow stock is hidden behind other products, often a sign of the wrong shelf capacity or case pack size. Or another product covers the empty slot, which the 2007 guide says is sometimes careless but more often intended, either to show shoppers full shelves or to keep gaps from managers.
On the walk, read each tag, check the product under it, look behind the front row and count a covered slot as a gap. Our guide to grocery planogram compliance covers the check of whether each product sits where the plan says.
Tell the team before the first walk that a visible gap is information, not a failure. The 2007 guide describes a three-month test in 20 stores of a European retailer. Each week in the test stores, a merchandiser put every product under its right tag and took away hidden stock and the products covering gaps, without refilling the empty slots from the backroom. Lost sales averaged 6% in those stores and 10% in matched stores that did not get the weekly fix.
Sort each gap into one of five causes
Once the walk finds a gap, ask three questions in order. Is the product in the building? If not, is an order open for it, and is it overdue? If there is no order, what does the record say? Every gap comes down to one of five causes: the product is in the building but not on the shelf, the order was too late or too small, the order was not delivered, the record shows stock that is not there, or the product cannot be ordered. The sorting is adapted from the root-cause flowchart in the appendix of the 2002 review.
In the 2002 review, ordering and forecasting problems in the store accounted for 47% of out-of-stocks, product in the store but not on the shelf for 25%, and upstream problems for 28%. In the five causes above, ordering and forecasting are causes 2 and 4, the shelf is cause 1, and upstream problems are causes 3 and 5. Treat the shares as estimates, since the authors note that the root causes were “estimated or calculated rather than directly measured.”

A wrong record is the easy cause to miss, because it says everything is fine. A record that shows stock that is not there is called phantom inventory, and the reorder system does not see how low the shelf is, so no order goes out. The 2007 guide describes a physical audit of more than 20,000 items in 121 stores of one major U.S. retailer. The record matched the stock on hand for 45.4% of the items. Shelves were empty for 4.1% of the items whose record matched and 8.9% of those whose record did not. Our guide to the retail cycle count process shows how to count and correct records.
Read the log, then fix the biggest cause first
Write each gap down: the product, the shelf location, the day and time, the cause and the day it was first seen. Add the date it was closed, so you can see how many days it stayed open. A peer-reviewed field study in wholesale stores found that the causes are specific to the retailer, the store, the category and the item, and that manual audits of stockouts and their causes give management the detail it needs to prioritize improvements.
After three or four weeks, read the log for patterns. The 2007 guide draws out-of-stocks on a weekly calendar and describes four patterns, each pointing to a likely cause. A log from frequent walks can show the same shapes:
Only on promoted products. The order was too small for the promotion. Raise it for the next one.
Short gaps on any day. The product is in the building but not always on the shelf. Add shelf space and restock more often.
The same days every week. Deliveries do not match demand. The 2007 guide’s example has two deliveries a week where four are needed, and it suggests more safety stock as an alternative.
Almost every day. The shelf holds less than a day of sales. Give the product more space and check it several times a day.
Then pick where to start. In the 2007 guide’s sales data, 20% of the items in a typical store bring in 80% of its sales in an average week, and high-demand items had almost six times the lost sales from out-of-stocks that low-demand items did. Keep a short never-out list: the top sellers, the products on promotion and any item shoppers keep asking for. Walk that list on every visit and the rest of the assortment less often.
Watch how long gaps stay open. In one U.S. retailer’s data on its 200 fastest-selling items over 14 days, 40% of the gaps lasted a day or less and almost one quarter lasted three days or more. In another retailer’s 12 months of data on 100 products, correcting only the gaps that lasted seven days or more would have cut the overall rate by more than 60%. A gap that is still open on the next walk goes to the top of the list.
Run the same walk in every store
When many stores log the same product, the cause is probably above the store. The 2002 review gives an example of 11 stores served by one warehouse. A product out of stock in one or two of them most likely points to the stores, in three to five to a policy, a delivery schedule or a promotion, in six to 10 to headquarters’ ordering for the warehouse, and in all 11 to the manufacturer. Use the same five cause names in every store so the logs can be compared, give each walk to one named person and send each gap to its owner with a due date.
A walk is easy to skip when nobody can see whether it happened. Bitreport task management sends the same repeating checklist to every location, with due dates and required photo proof, and managers can follow completion by location. On store visits, a failed item in an audit creates a corrective task with an assignee, a due date and a photo proof request, and repeated issues are flagged.
Bitreport is not an inventory system, does not place orders and does not detect gaps from photos on its own, so the records and the orders stay in your own systems. To see how a recurring shelf walk looks across locations, book a Bitreport demo.
Frequently asked questions
What is the out-of-stock rate in retail?
An out-of-stock is a product the store means to sell that a shopper cannot find in its place. The out-of-stock rate is the share of products on a fixed list that have an empty slot during the walk. If 5 of the 50 products on the list have an empty slot, the rate is 5 ÷ 50 × 100 = 10%. For scale, the 2002 review averaged 8.3% across 40 studies, with most between 5% and 10%, and faster-selling or promoted products regularly above 10%.
What causes out-of-stocks in retail stores?
Every gap comes down to one of five causes: the product is in the building but not on the shelf, the order was too late or too small, the order was not delivered, the record shows stock that is not there, or the product cannot be ordered. In the 2002 review, ordering and forecasting problems in the store accounted for 47% of out-of-stocks, product in the store but not on the shelf for 25%, and upstream problems for 28%.
When should a store walk the shelves to count out-of-stocks?
In 13 studies that reported time of day, the highest rates came in the evening, after 8:00 PM, and the lowest in the early afternoon. Walk at set times that include an evening and a weekend day, and write the time next to every count. Keep a short never-out list: the top sellers, the products on promotion and any item shoppers keep asking for. Walk that list on every visit and the rest of the assortment less often.
Why are shelves empty when the system shows stock?
A wrong record is the easy cause to miss, because it says everything is fine. A record that shows stock that is not there is called phantom inventory, and the reorder system does not see how low the shelf is, so no order goes out. The 2007 guide describes a physical audit of more than 20,000 items in 121 stores of one major U.S. retailer. The record matched the stock on hand for 45.4% of the items. Shelves were empty for 4.1% of the items whose record matched and 8.9% of those whose record did not.