

Sales are down at one store. Before changing the promotion or asking the team to sell more, you need to know what changed: fewer visitors, fewer purchases per visit, smaller baskets, missing products, or a problem with execution.
Retail store analytics connects those signals so managers can investigate a result and choose a useful response. Start with a specific store question, a small set of consistently defined metrics, and a way to check whether the resulting action happened.
This guide explains the data sources, calculations, and review process for physical stores, with a worked example you can adapt to your own locations. For the broader responsibilities and routines behind those decisions, see our guide to retail operations.
What is retail store analytics?
Retail store analytics is the collection and analysis of sales, traffic, inventory, customer, and operational data to understand how physical stores perform. It helps retailers identify changes, investigate their causes, and evaluate improvements across individual locations or a store network.
The terms “store analytics” and “in-store analytics” overlap. In-store analytics often emphasizes what happens on the shop floor: visits, movement through departments, time spent in an area, and queues. A broader store review also includes transactions, stock availability, labor context, and compliance with operating standards.
A point-of-sale report shows what customers bought. It cannot, on its own, show how many visitors left without purchasing or whether a promotion was displayed correctly. Connecting those sources makes the sales result easier to investigate.
Four types of analysis, using one store problem
Descriptive analysis establishes what happened: conversion fell this week. Diagnostic analysis investigates possible reasons, such as availability, waiting times, or a different visitor mix. Predictive analysis estimates future outcomes, such as demand by location. Prescriptive analysis recommends a response, such as a replenishment or staffing change.
Start with reliable descriptive and diagnostic work. Forecasts and recommendations need suitable history, testing, and clear assumptions; adding AI does not resolve missing or inconsistent store data.
Which data should you collect?
Choose data according to the decision you need to make. A shelf-availability problem requires different evidence from a question about repeat purchasing.
| Data source | What it contributes | Question it can help answer |
|---|---|---|
| POS and transaction reports | Sales, purchase transactions, units, discounts, returns | Did fewer purchases or smaller baskets reduce sales? |
| Footfall counters and in-store sensors | Visits by time period; movement, dwell, or queue measures where supported | Did traffic change, and when did demand peak? |
| Inventory system and shelf checks | Recorded stock, movements, product availability on the floor | Is the item unavailable, or is stock failing to reach the shelf? |
| Workforce records | Worked hours, role coverage, absences | Did service coverage match the busiest trading periods? |
| Loyalty records and customer feedback | Identified purchase history, complaints, survey responses | What do participating customers buy or report repeatedly? |
| Audits, tasks, and incident records | Standards checks, display evidence, unresolved issues, corrective work | Was the store ready, and were identified problems fixed? |
For customer analysis, distinguish the people you can identify from everyone who visits. Loyalty members are a subset of customers, and survey respondents may differ from people who do not respond. Do not treat either group as a complete picture of the store’s audience.
Choose the least detailed data that answers the question. Aggregate visits may be enough to compare busy periods; identifying individual shoppers is not a prerequisite for a useful store scorecard. Before introducing customer or employee tracking, have the responsible team review access, retention, and applicable privacy requirements.
Make the sources comparable
Use consistent store IDs, business dates, and reporting periods. Match product IDs when analyzing specific items. Keep online orders, click-and-collect, returns, and in-store purchases distinguishable so they are not silently counted in the wrong channel.
Start by summarizing each source at the same level, such as one record per store per day. Joining every transaction directly to every audit response can multiply records and inflate totals. Check the combined totals against the original reports before relying on a dashboard.
Record gaps explicitly. A broken traffic counter means conversion is unavailable for that period; it does not mean there were zero visitors. Missing shelf checks are a coverage problem, not proof that every product was available.
Retail store analytics metrics to track
Select metrics that help answer your current question. A useful starting scorecard might combine sales, conversion, average transaction value, availability checks, and overdue corrective work. Add more detail when someone will use it to make a decision.
| Metric | Definition or calculation | Interpretation check |
|---|---|---|
| Net sales | Gross merchandise sales less discounts and returns, excluding sales tax | Use the same treatment of returns and sales channels in each comparison |
| In-store conversion rate | Purchase transactions ÷ counted store visits × 100 | Use visits and purchases from the same locations and trading hours |
| Average transaction value (ATV) | Sales value on the agreed basis ÷ corresponding purchase transactions | A higher value may reflect price or product mix, not more items |
| Units per transaction (UPT) | Units sold ÷ corresponding purchase transactions | Distinguish more items from higher-priced items |
| Gross margin percentage | (Net sales − cost of goods sold) ÷ net sales × 100 | This is before operating expenses; it is not net profit |
| Inventory turnover | Cost of goods sold ÷ average inventory value at cost for the same period | Compare like periods and categories; a high ratio can coexist with shortages |
| Observed on-shelf availability | Available item-location observations ÷ all valid item-location observations × 100 | Define the product sample, check times, and availability rule |
| Standards compliance | Passed applicable checks ÷ completed applicable checks × 100, for an unweighted checklist | Keep checklist versions consistent and show audit coverage separately |
| On-time corrective completion | Actions due in the period and completed by their deadlines ÷ all actions due in the period × 100 | Include overdue, unfinished actions in the denominator |
Definition references: Shopify on average transaction value, retail metrics, and inventory turnover. Operational formulas above are proposed working definitions; align them with your checklist scoring and completion rules.
For the wider selection of sales, customer, and inventory measures, see our retail KPI guide.
Three calculations that need clear definitions
Conversion is a measure of purchasing relative to traffic. Count purchase transactions, not individual products or payment attempts.
In-store conversion rate = (purchase transactions ÷ counted store visits) × 100
A traffic counter may include companions, repeat entries, or staff, depending on its configuration. Transactions divided by visits is therefore a practical store measure, not an exact percentage of unique people who bought. Use a consistent counting method, exclude staff where supported, and keep collection-only visits separate where possible. Without trustworthy footfall data, report transaction trends rather than inventing a conversion rate.
Average transaction value measures the sales value associated with each purchase transaction.
Average transaction value = sales value ÷ corresponding purchase transactions
Document whether your report uses gross or net sales and how it handles returns. A refund-only visit should not become an additional purchase transaction. For the example below, there are no returns, tax is excluded, and sales values are after discounts.
Inventory turnover needs cost values in both parts of the calculation.
Inventory turnover = cost of goods sold ÷ average inventory value at cost
Use average inventory over the same period as the cost of goods sold. An average of opening and closing inventory is a simple approximation; frequent balance snapshots can better represent large movements during a season. Do not compare a monthly turnover ratio directly with an annual one.

Retail store analytics example: traffic rises but sales fall
Imagine a store comparing two full trading weeks with the same opening hours and traffic-counting method. These are illustrative numbers, not a Bitreport customer result or an industry benchmark.
| Measure | Previous week | Current week | Change |
|---|---|---|---|
| Counted visits | 1,000 | 1,100 | +10% |
| Purchase transactions | 200 | 198 | −1% |
| Net sales | $10,000 | $9,900 | −1% |
| In-store conversion | 20% | 18% | −2 percentage points |
| Average transaction value | $50 | $50 | No change |
Sales alone show a small decline. The other measures show that the store attracted more visits but generated slightly fewer purchases, while spend per purchase stayed the same. Start by investigating the conversion change instead of assuming that attracting more traffic is the answer.
Check conversion by day and trading hour. Review product availability, recent returns or counter changes, queue observations, staff coverage, and any changes in promotion or visitor mix. A store-level average can hide a problem concentrated in one department or a short peak period.
Suppose a floor check then finds that a promoted item is missing from its display even though the inventory record shows stock on hand. That is a concrete issue to investigate: the stock may be in the backroom, in the wrong location, or incorrectly recorded. It is not yet proof that the empty display caused the entire conversion decline.
Assign the stock check and any required replenishment to a named owner, set a deadline, and request evidence of the corrected display. Afterward, monitor availability and comparable trading periods. Keep other changes visible so an improvement is not automatically credited to that one action.
The sequence is straightforward: observe the change, investigate it, act on a verified finding, and review the result.
How to start using retail store analytics
1. Choose one decision and a useful baseline
Pick a question your team can act on: why a store’s conversion dropped, whether promoted products remain available, or which locations repeatedly miss standards. Define the owner of the decision and the period you will review.
Use several comparable periods where available, not a single unusually strong day. Note promotions, holidays, closures, and changes in opening hours. The baseline should describe the situation before the action you plan to evaluate.
2. Agree the definitions before building a dashboard
For each chosen metric, record its source, calculation, reporting period, refresh timing, and responsible owner. State what is excluded and what happens when data is missing or the denominator is zero. Show “not available” when a rate cannot be calculated meaningfully.
For audit results, define the checklist version, weighting, and treatment of non-applicable items. Pair compliance scores with completed-versus-planned audits. A high score from a small, selective set of checks is not evidence that the whole store network meets the standard.
3. Build a dashboard that supports a decision
Begin with the few measures selected for your question. Display the current result, a relevant comparison, and the underlying counts. Include the last refresh time and an obvious indication of missing data.
Use a trend chart to show how a measure changes over comparable periods.
Use a store table to find exceptions and open the supporting detail.
Use hourly or daily views when a weekly average hides peak-period problems.
Include an action owner, due date, and status beside findings that require follow-up.
You can start with a spreadsheet and controlled exports. The important requirement is a repeatable process with reconciled totals. Move to more automated reporting when maintaining the report consumes too much time or creates avoidable errors.
4. Compare similar stores and investigate exceptions
Group locations by relevant characteristics: format, size, assortment, trading hours, maturity, and catchment. Compare each store with its own history as well as suitable peers. A new store and an established flagship should not be judged solely on their sales totals.
When calculating a network conversion rate, divide total purchase transactions by total counted visits. Do not take an unweighted average of store percentages unless you deliberately want each store to have equal weight. Apply the same care to audit rates: an average store score and a pooled check-level pass rate answer different questions.
Bring staff observations into the investigation. A report may identify where to look, while a store visit reveals missing signage, a blocked fixture, or an item that customers cannot find. Our retail performance analysis guide covers the wider habit of reviewing commercial and operational performance together.
5. Review actions at the next meeting
Make the next review start with previously agreed actions. Confirm what was completed, what remains blocked, and whether the original problem persists. A task marked complete and a business result moving in the right direction are separate checks.
Match the cadence to the decision. An active promotion may need daily availability checks. Weekly reviews can identify recurring store problems. Slower-moving assortment or inventory questions may need monthly or seasonal analysis. Faster data is useful when someone can respond to it.
A weekly store analytics review template
Use this outline in your existing report or meeting notes. Keep the review focused on a small number of findings that can lead to action.
Scope: store or peer group, reporting dates, comparison period, and any missing data.
Signal: the metric that changed, its current and previous values, and the underlying counts.
Evidence: the transactions, availability checks, audit findings, or staff observations supporting the investigation.
Action: the specific correction or test, one accountable owner, a deadline, and the evidence required for completion.
Follow-up: when the team will check completion and when it will review the business outcome.
For the example above, a useful action note would be: “Store A: conversion fell from 20% to 18%. Check the promoted item’s recorded and physical stock. Store manager to restore the display or escalate the discrepancy before Friday opening, attach a current photo, and review availability at the next daily check. Revisit conversion after the next comparable trading week.”
That note records a finding and a response without claiming to have proved causation. If several initiatives change at once, record them and be cautious about attributing the result to one intervention.
Which tools do you need for retail store analytics?
If you are choosing the systems that will supply your data, our guide to retail software categories explains where POS, inventory, operations, and analytics tools fit.
Choose tools by the data and work they need to handle. Your POS may already cover transaction reporting. A traffic system provides visit counts. Inventory software supplies stock records. A spreadsheet or business intelligence tool can combine exports for analysis, while an operations platform manages checks, findings, and corrective work.
Before committing to a new tool, test it with a real store question and a small sample of your data. Confirm that it can show the underlying records, preserve store and product identifiers, handle missing data, and export usable results. Identify who will maintain connections and definitions after setup.
If the question concerns movement, dwell time, or queues, evaluate the relevant in-store measurement equipment and its coverage. A POS dashboard does not create footfall data, and a camera-based system does not automatically provide reliable customer identities or complete sales attribution.
Where Bitreport fits
Bitreport supports the operational part of the picture: store checks, audit scores, tasks, photo evidence, and follow-up across locations. Its audits and checklists help teams collect findings consistently and turn failed items into corrective work. Managers can review completion and unresolved issues alongside their separate commercial reports.
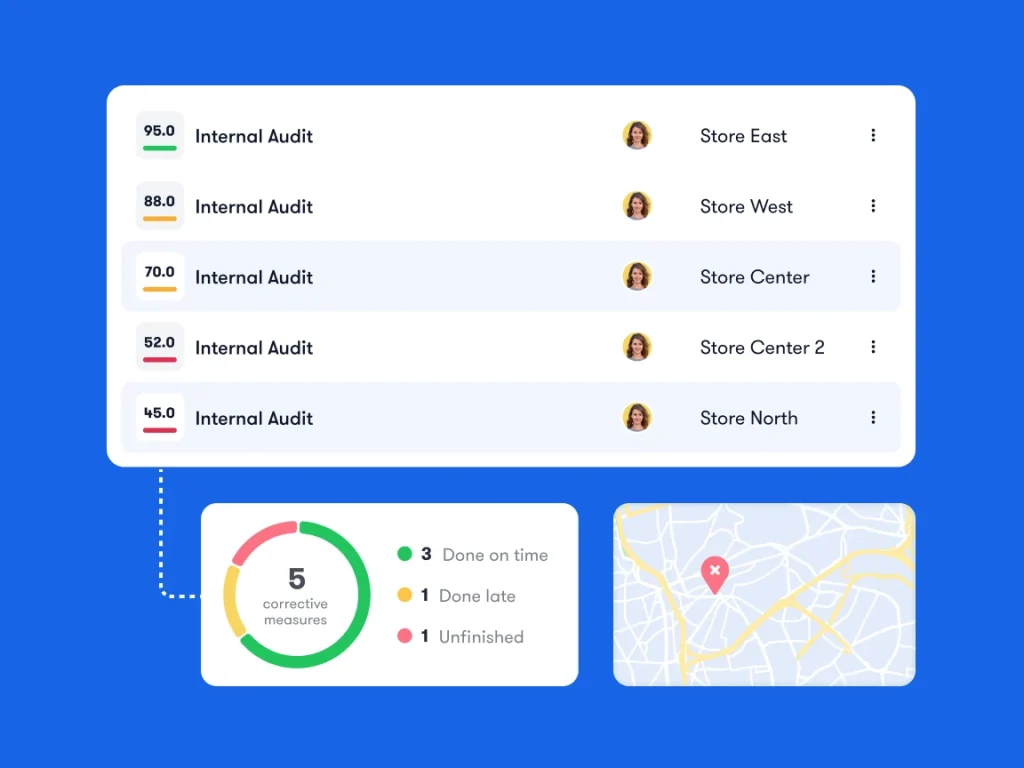
Bitreport product illustration. The sample scores and action counts shown are illustrative interface data.
This is useful when the sales report identifies a store that needs attention but the next question is operational: were the checks completed, what failed, and was it fixed? Confirm any required data transfer or integration separately; Bitreport should not be treated as a replacement for POS, inventory accounting, footfall measurement, or a general BI platform.
In Bitreport’s published Offertissima case study, the retailer digitized store-visit checklists, introduced assigned follow-up, and used monthly reporting to review checklist completion, task fulfillment, and differences between stores. The useful example is the connection between structured evidence and management action, rather than a dashboard viewed in isolation.
Turn your next store finding into a clear action
Start with one question, verify the data behind it, and agree who will act on the finding. Expand your analytics only when the next measure supports another useful decision.
If your reporting already highlights store issues but follow-up is scattered across messages and spreadsheets, bring one audit or store review to a Bitreport demo. We can show how findings become assigned corrective tasks with deadlines and photo evidence.