

Here’s a stat worth chewing on: In October 2024, U.S. consumers spent more at restaurants than on groceries – for the first time ever. Restaurants now account for 56.4% of all food sales.
That’s massive. It means more and more people are choosing to dine out, grab takeout, or order in, and the competition for their attention (and wallets) is only getting hotter.
If you want your restaurant to keep up, survive, and succeed in this fast-moving space, gut feeling isn’t enough. You need data. The good kind: the kind that tells you what’s working, what’s slowing you down, and where the money’s going.
This post breaks down restaurant analytics in plain English: what to track, how to use it, and why it can make all the difference between running a smooth shift and wondering where the night went.

What Are Restaurant Analytics, Really?
Restaurant analytics just means using data to understand how your business is performing across sales, labor, operations, customer behavior, and more.
It’s not about drowning in dashboards. It’s about spotting trends, solving problems, and making smarter calls based on facts.
When used right, restaurant analytics can help you:
Find out where you’re leaking money
Spot your top-performing dishes or shifts
Plan staffing based on real demand
Improve table turnover without rushing the guest
See what’s working (and what’s not)
Most Useful Restaurant Analytics You Should Track
Sales Analytics: What’s Selling, When, and How Much
Why it matters: This is your revenue engine. Tracking sales by item, time of day, day of week, and even server helps you spot patterns – like which dishes fly out the door on weekends, or when happy hour really peaks.
Key metrics to track:
Daily and weekly sales trends
Best-selling menu items (and worst)
Average order value (AOV)
Revenue by service type (dine-in, takeout, delivery)
Sales by time of day (e.g. happy hour insights)
Use this data to optimize your menu, pricing, and promos. If that $18 burger sells like crazy at lunch but not dinner, adjust your specials accordingly.

Labor Analytics: Staffing Smarter, Not Harder
Why it matters: Labor usually eats up a huge part of your budget, and it’s easy to overspend if you’re not careful. Tracking labor costs alongside sales helps you schedule smarter, avoid unnecessary overtime, and keep the team efficient without burning anyone out.
Getting labor right means better profits and a happier crew.
Key metrics to track:
Labor cost as % of sales
Hours worked per role
Sales per labor hour (SPLH)
Overtime hours
No-show and callout patterns
Operational Analytics: What’s Slowing You Down
Why it matters: Messy operations are usually the root of late openings, chaotic shifts, and burnout. Tracking task completion, shift notes, and prep times can help you spot what’s slowing things down, whether it’s a staff bottleneck, missing inventory, or a process that needs fixing.
Use this data to tweak routines, rebalance responsibilities, or just cut the noise. A few small fixes can lead to smoother shifts, happier teams, and way fewer last minute surprises.
Metrics worth tracking:
Late openings or missed tasks
Average table turnover time
Ticket times (kitchen speed)
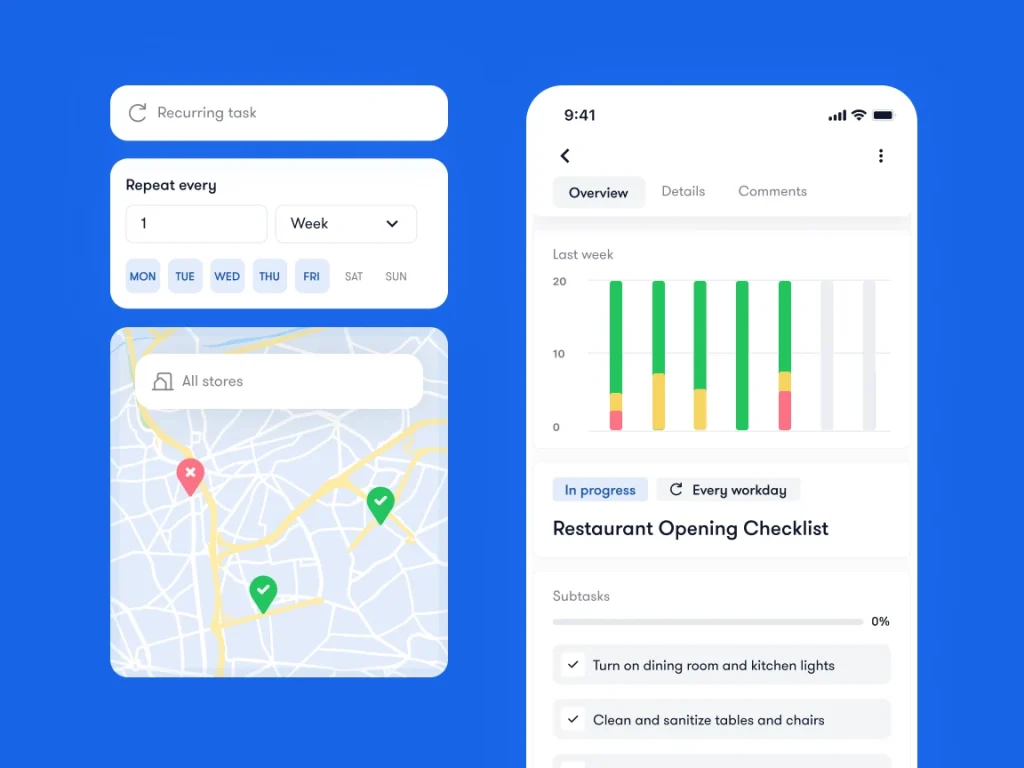
Task completion rates (from checklists)
Maintenance logs and issue frequency
With tools like Bitreport, you can track daily checklists, flag recurring issues, and see what’s slipping, all in real time.
Inventory Analytics: No More 7pm Ketchup Runs
Why it matters: Running out of key ingredients in the middle of the service usually means lost sales, stressed staff, and unhappy guests. On the other side, over-ordering leads to waste and cuts into your margins.
Tracking inventory trends helps you spot what’s moving fast, what’s collecting dust, and when it’s time to reorder. When you track your inventory data consistently, you’ll notice if a supplier is delivering late, shorting your orders, or sending inconsistent quality. With data to back you up, it’s easier to flag issues and ask for better service.
Track things like:
Par level adherence
Waste and spoilage reports
Stock turnover rate
Top items running low
Supplier delivery consistency
Stop relying on “I think we have enough.” Use actual numbers to plan your orders and cut waste.
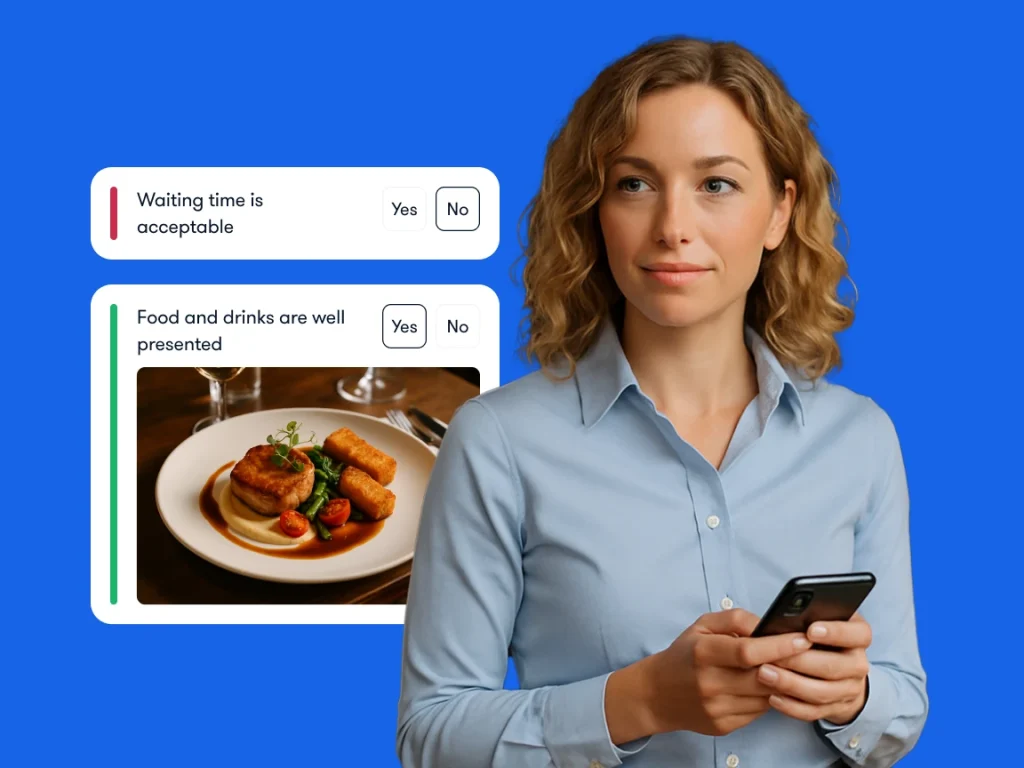
Guest Experience Analytics: What the Data Says About Your Diners
Why it matters: Happy guests tip better, leave good reviews, and most importantly, they return. But if your service is slow, orders are wrong, or the vibe is off, they probably won’t say anything. They’ll just stop showing up.
That’s where analytics come in. If you track things like ticket times, table turnover, review trends, and even complaints, you can spot what’s working and what’s quietly hurting the guest experience. Then fix it before it costs you repeat business.
Look at:
Table turnover time vs. satisfaction ratings
Repeat visit frequency
Online reviews and sentiment trends
Wait times (actual vs. expected)
Complaint categories
Combine this with staff feedback to improve service, training, and table flow.
Financial Analytics: Zooming Out
Why it matters: This is where you step back and ask: is the restaurant actually making money? Tracking key financial metrics like prime cost, labor %, and profit margins helps you see how all the moving parts are affecting your bottom line.
Use this data to spot rising costs, cut waste, or rework pricing. When you’ve got a clear view of your numbers, it’s way easier to make smart decisions, not just survive the month.
Must-watch metrics:
Profit margin (gross and net)
Cost of goods sold (COGS)
Prime cost (labor + COGS)
Break-even point
Monthly revenue vs. target
You don’t need a CFO to keep an eye on this stuff, just a regular rhythm for reviewing it.
Final Thoughts: Smarter Restaurants Run on Data
Good analytics don’t replace your gut, they support it. They help you spot problems early, coach your team better, and plan with confidence.
You don’t need a full BI team or a wall of monitors. You just need a simple way to see what’s working – and what needs work.
Want an easier way to track tasks, spot ops issues, and run smoother shifts? Bitreport gives you the operational data you need, without the spreadsheet headache.